Fed Data Shows Richest 10% Pulling Away as Young Families Lose Ground
The Fed's 2025 Survey of Consumer Finances found median wealth for the richest 10% of families jumped 31%, while typical household wealth rose just 2%.
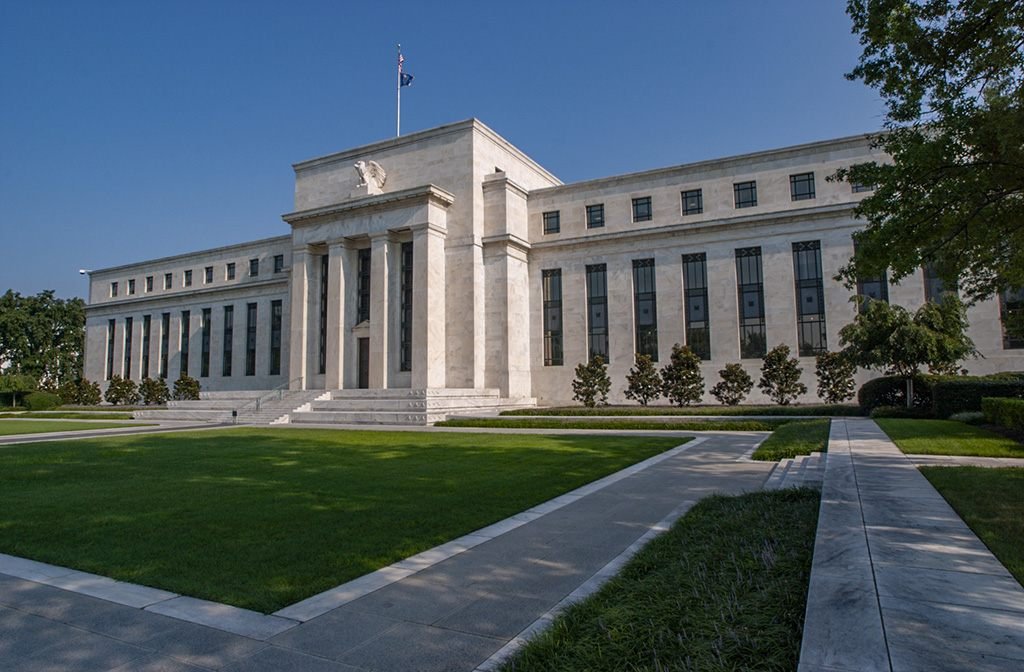
The wealthiest American families have opened up a wider lead over everyone else, according to the Federal Reserve’s latest Survey of Consumer Finances, a detailed snapshot of household balance sheets that the central bank publishes every three years. Median net worth for the richest tenth of families rose 31% between 2022 and 2025, to about $3.6 million, CBS News reported. The typical American household, by contrast, saw its wealth grow just 2% after inflation, to $215,900, the Fed said.
The results, released by the Fed’s Board of Governors on Oct. 9, have drawn renewed attention this week as a Democratic Congress prepares to take power after midterm elections dominated by voter frustration over the cost of living.
What the survey found
The Survey of Consumer Finances is conducted for the Fed by NORC at the University of Chicago, a nonpartisan research organization, and has run every three years since 1989. All figures are adjusted for inflation.
According to the Fed’s statement, average (mean) net worth across all families rose 7% to $1.24 million. The gap between that figure and the median of $215,900 shows how heavily wealth is concentrated at the top: a relatively small number of very rich households pull the average far above what a typical family holds.
The picture was much weaker further down the ladder. IBTimes, summarizing the Fed data, reported that median net worth for the bottom 20% of earners fell 6%, and mean net worth for that group fell 4%. Median wealth for Black families dropped 25%. Families headed by someone under 35 saw median net worth fall 23%, to $33,000, according to CBS News, which said the decline mainly reflected smaller gains in business equity for that group.
Why the rich got richer
The main driver was the stock market. CBS News noted that the S&P 500 gained roughly 78% from the end of 2022 through 2025, and IBTimes wrote that those gains made the wealthiest Americans even wealthier. Because stock ownership is concentrated among higher-income and older households, a rally of that size widens the gap between those who own shares and those who do not.
The Fed’s figures support that view. The share of families holding any stocks, directly or through funds and retirement accounts, actually fell from 58% to 56%. But among families that did own stocks, the median holding rose 36%, to $77,400 from $56,900.
Older Americans also did well. Households headed by someone 75 or older had the highest median net worth of any age group, about $504,000, CBS News reported. The outlets differed on one detail: CBS attributed a 37% rise in median wealth to households headed by 65- to 74-year-olds, while IBTimes attributed a 37% gain to families headed by someone over 75.
Housing offered steadier but smaller gains. The homeownership rate held at about 66%, and the median net housing value for homeowners, meaning home value minus mortgage debt, rose to $230,000 from $218,900, the Fed said.
Signs of strain for many households
While wealth rose at the top, the survey found growing financial pressure elsewhere. In the words of the Fed, families “were more likely to be behind on their financial obligations than at any point since the 2010 survey.” About 20% of households were behind on debt payments in 2025, up from 12% in 2022, according to IBTimes; CBS News described the increase as a 7-percentage-point jump.
The share of families spending more than 40% of their income on debt payments rose to 8.6% from 6.5%, the Fed said, a level last seen in the 2013 survey. The overall share of families with any debt stayed steady at about 77%.
Income trends ran in the opposite direction from wealth. Real median family income rose 7% to $82,200, while mean income fell 6% to $145,200, the Fed reported, as families at the upper end of the income scale saw declines. Income figures in the survey cover the prior year, 2021 to 2024.
What comes next
The survey ends in 2025, so it does not capture this year’s renewed rise in prices driven by energy costs, CBS News noted. Mortgage rates have also climbed: Freddie Mac, the government-sponsored mortgage company, reported the average 30-year fixed rate reached 7.4%, its highest since November 2023, according to IBTimes.
Those pressures, along with the widening wealth divide, are likely to feature in debates in Washington as the new Congress takes up affordability. The data describe how assets were distributed through 2025; how much policy can change that picture in the near term remains uncertain.